Energy Corridor Office Market Report (Katy Freeway market)
[fusion_builder_container hundred_percent=”yes” overflow=”visible”][fusion_builder_row][fusion_builder_column type=”1_2″ last=”no” spacing=”yes” center_content=”no” hide_on_mobile=”no” background_color=”” background_image=”” background_repeat=”no-repeat” background_position=”left top” border_size=”0px” border_color=”” border_style=”” padding=”” margin_top=”” margin_bottom=”” animation_type=”” animation_direction=”” animation_speed=”0.1″ class=”” id=””][fusion_imageframe lightbox=”no” lightbox_image=”https://www.workspacerealestate.com/wp-content/uploads/2016/06/katy-vacant-space.jpg” style_type=”glow” bordercolor=”” bordersize=”0px” borderradius=”0″ stylecolor=”” align=”none” link=”https://www.workspacerealestate.com/wp-content/uploads/2016/06/katy-vacant-space.jpg” linktarget=”_self” animation_type=”0″ animation_direction=”down” animation_speed=”0.1″ hide_on_mobile=”no” class=”” id=””] 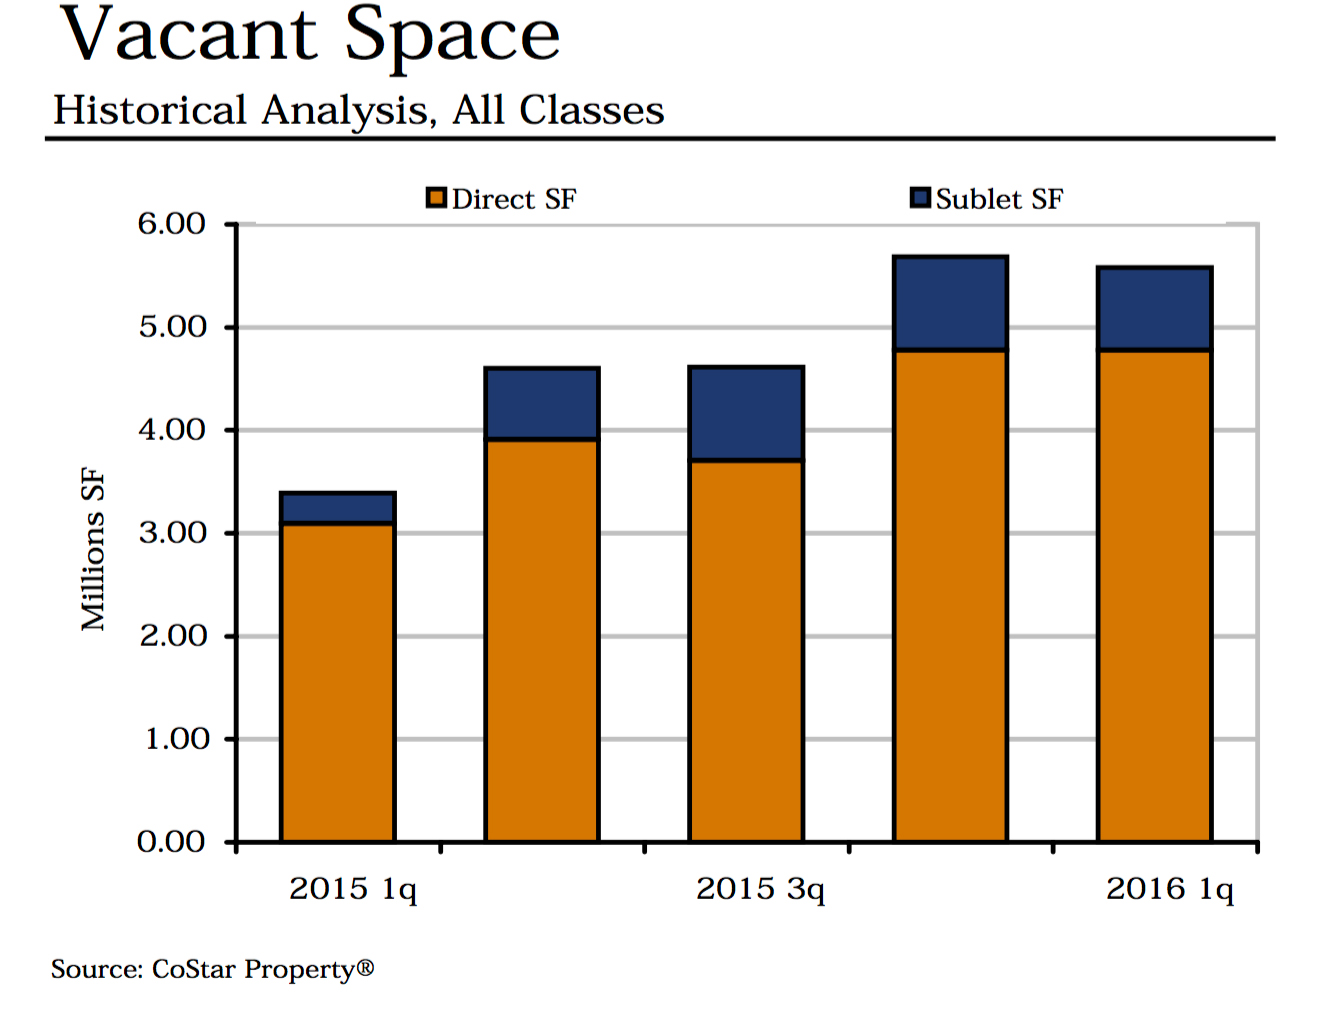 [/fusion_imageframe][/fusion_builder_column][fusion_builder_column type=”1_2″ last=”yes” spacing=”yes” center_content=”no” hide_on_mobile=”no” background_color=”” background_image=”” background_repeat=”no-repeat” background_position=”left top” border_size=”0px” border_color=”” border_style=”” padding=”” margin_top=”” margin_bottom=”” animation_type=”” animation_direction=”” animation_speed=”0.1″ class=”” id=””][fusion_text]The energy corridor historically has had the lion’s share of new construction and growth in the Houston market with the Woodlands being the other exception. Looking at the 1st quarter numbers it is clear that this area has been overbuilt as far as office space is concerned for now and the market will have to take some time to catch up.[/fusion_text][/fusion_builder_column][fusion_builder_column type=”1_1″ last=”yes” spacing=”yes” center_content=”no” hide_on_mobile=”no” background_color=”” background_image=”” background_repeat=”no-repeat” background_position=”left top” border_size=”0px” border_color=”” border_style=”” padding=”” margin_top=”” margin_bottom=”” animation_type=”” animation_direction=”” animation_speed=”0.1″ class=”” id=””][fusion_text]Click edit button to change this text.[/fusion_text][/fusion_builder_column][fusion_builder_column type=”1_1″ background_position=”left top” background_color=”” border_size=”” border_color=”” border_style=”solid” spacing=”yes” background_image=”” background_repeat=”no-repeat” padding=”” margin_top=”0px” margin_bottom=”0px” class=”” id=”” animation_type=”” animation_speed=”0.3″ animation_direction=”left” hide_on_mobile=”no” center_content=”no” min_height=”none”][fusion_text]
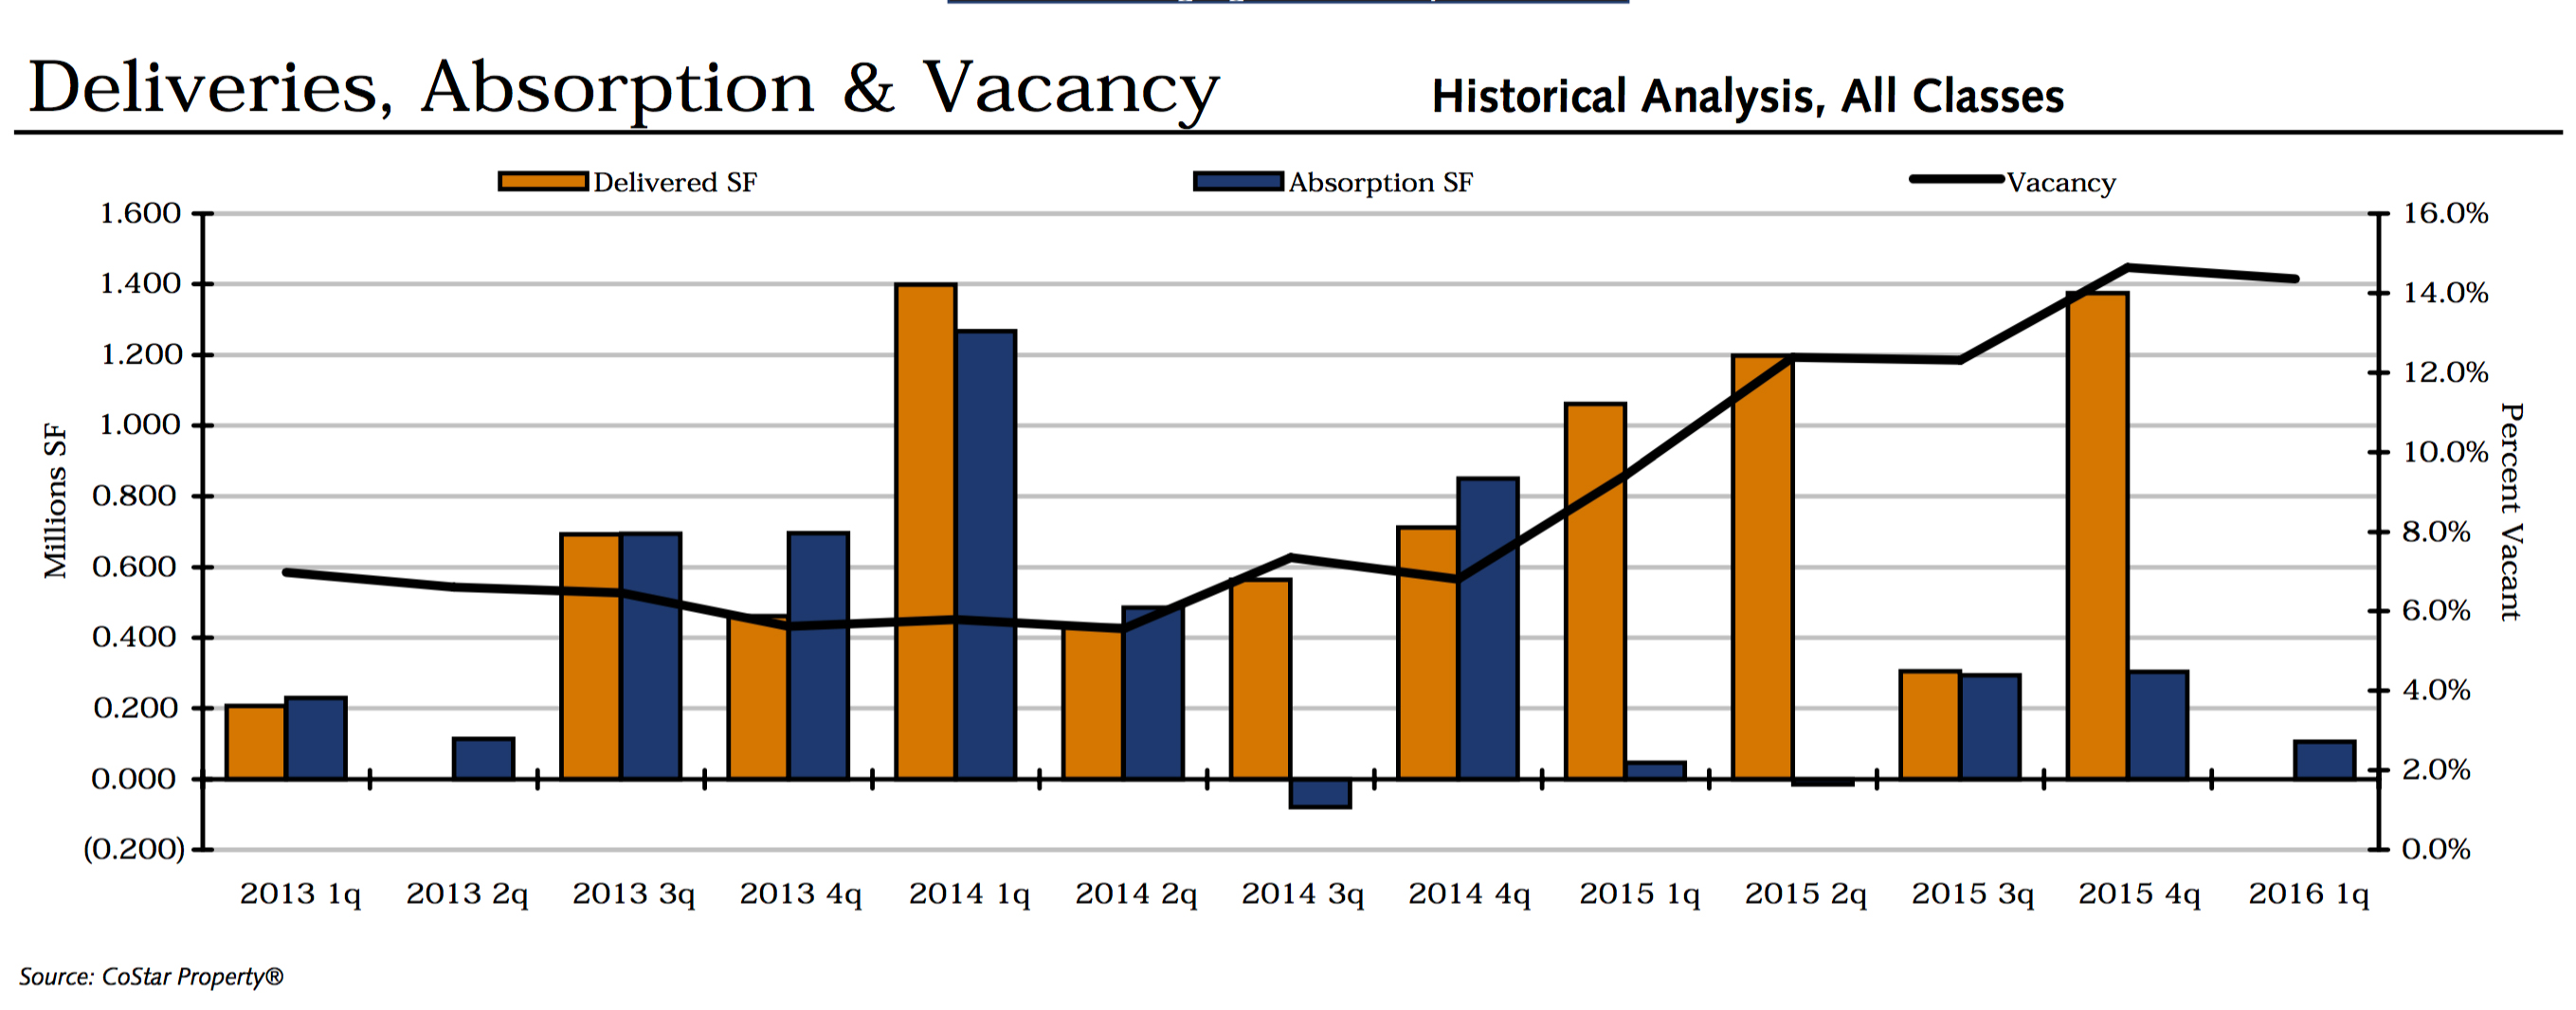
2013 and 2014 New office construction kept up with demand and vacancy rates stayed below 8%. At the end of 2014, the bottom fell out in this market and there was a million square feet construction delivered to the market with very little positive absorption. Vacancy rates shot up to 10%. The next quarter the market brought online an additional 1.2 million SF of office space and this market responded negative absorption bringing the vacancy rate up to 12% in the 2nd quarter of 2015. Right now, the vacancy rate is north of 14% and construction has stopped in this market for now with no new space being delivered to the market this quarter.
You can see from this chart that the Vacant space has been steadily increasing since 2015 while the amount of sublet space has been pretty consistent. Now that construction has stopped, we should expect to see vacancies taper down as the market catches up with all of the new construction. This market really shows how the price of oil has affected the Houston market when you look at the first two charts.
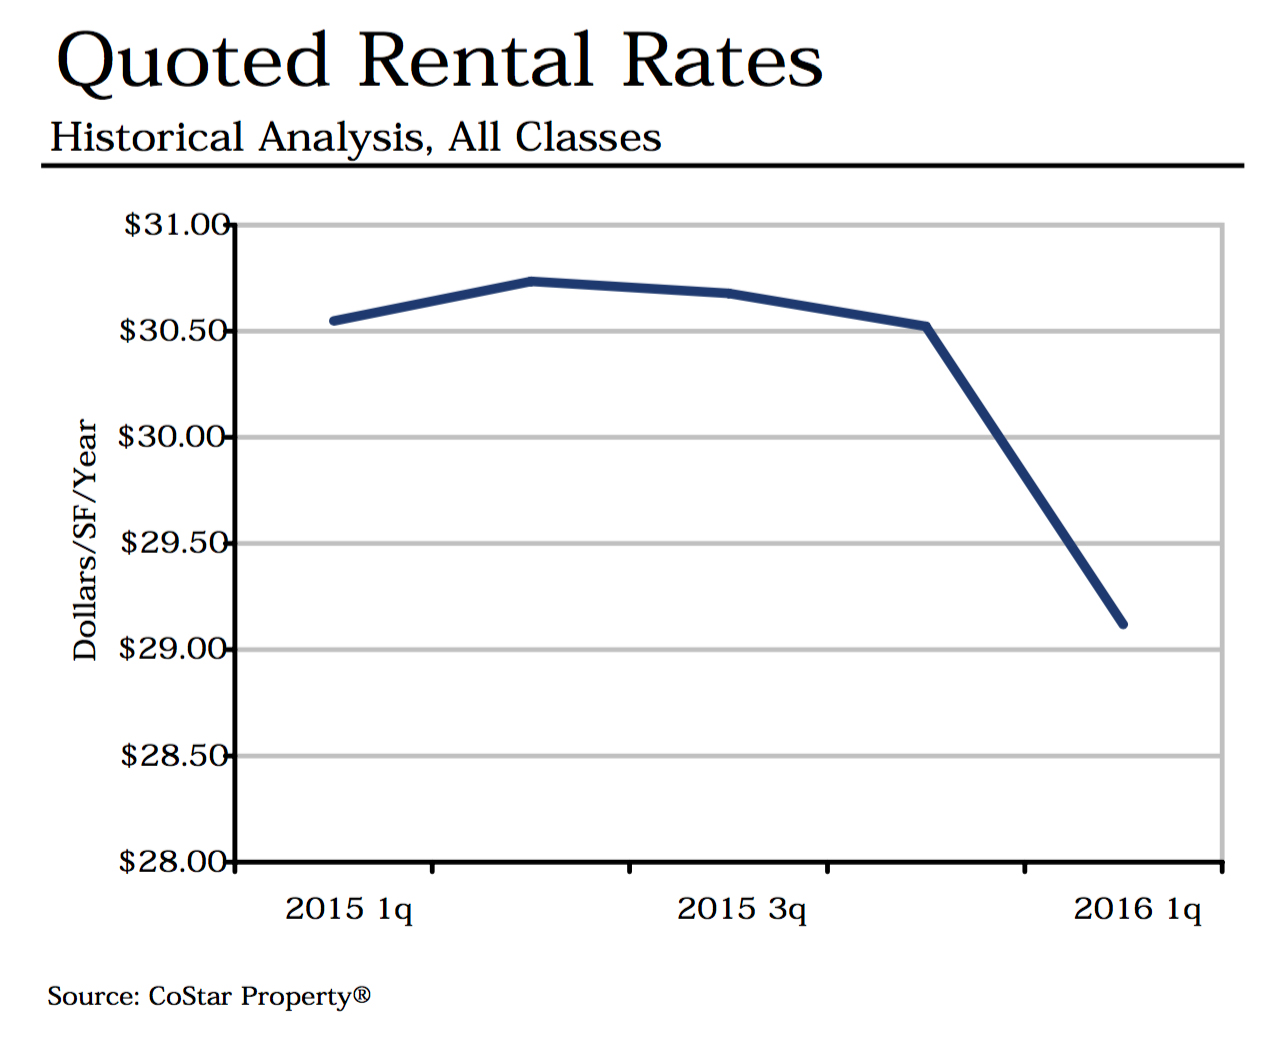
The average rental rates has seen a decline in this market from a high of $30.75 down to $29 bucks a foot. This again highlights the sensitivity to the energy sector that this market has. Other major markets have higher vacancies over longer periods of time without reducing rates. This shows that Landlords feel the need to incentivize deals and give businesses in the energy sector a chance to capture more value. Neighboring office markets offer similar access with more competitive rental rates. With that being said, we do not believe that the decline in rental rates will bring more business to the Energy Corridor, we believe it will slow down negative absorption and Houston’s continued growth and the increase in the cost of oil over time will do the rest to bring vacancy rates back down and stabilize rental rates.
From 2012 until the 1st quarter of 2016 this market has gone from 462 buildings that made up 30 million square feet up to 504 buildings that make up 39 million square feet of space. The major take away from this last quarter’s numbers is that Houston’s rapid growth is obscuring just how significant the change in the price of oil has affected this market. If oil stayed at pre 2015 levels I think we would have seen vacancy rates almost cut in half in this market and we would be at a 7% to 8% vacancy rate instead of 14%.
This is a great time to consider renegotiating long term leases as well as considering all of your options when looking where to lay your hat in this market. Some landlords will be more incentivized than others, but it is clear that enough of them have lowered rates to drop the average rent under $30 bucks a foot. Compare this adjustment to downtown Houston that has a similar vacancy rate but the average rents have gone up from $36 bucks a foot the fist quarter of 2015 up to $39 the first quarter of 2016. [CBD Historical Rent All Classes]
What are your thoughts on the energy corridor? Do you see the market bouncing back this year or do you expect more adjustments will be necessary? Leave your thoughts in the description and we will meet you there to talk! Thanks for watching![/fusion_text][fusion_text]
2013 and 2014 New office construction kept up with demand and vacancy rates stayed below 8%. At the end of 2014, the bottom fell out in this market and there was a million square feet construction delivered to the market with very little positive absorption. Vacancy rates shot up to 10%. The next quarter the market brought online an additional 1.2 million SF of office space and this market responded negative absorption bringing the vacancy rate up to 12% in the 2nd quarter of 2015. Right now, the vacancy rate is north of 14% and construction has stopped in this market for now with no new space being delivered to the market this quarter.
You can see from this chart that the Vacant space has been steadily increasing since 2015 while the amount of sublet space has been pretty consistent. Now that construction has stopped, we should expect to see vacancies taper down as the market catches up with all of the new construction. This market really shows how the price of oil has affected the Houston market when you look at the first two charts.
The average rental rates has seen a decline in this market from a high of $30.75 down to $29 bucks a foot. This again highlights the sensitivity to the energy sector that this market has. Other major markets have higher vacancies over longer periods of time without reducing rates. This shows that Landlords feel the need to incentivize deals and give businesses in the energy sector a chance to capture more value. Neighboring office markets offer similar access with more competitive rental rates. With that being said, we do not believe that the decline in rental rates will bring more business to the Energy Corridor, we believe it will slow down negative absorption and Houston’s continued growth and the increase in the cost of oil over time will do the rest to bring vacancy rates back down and stabilize rental rates.
From 2012 until the 1st quarter of 2016 this market has gone from 462 buildings that made up 30 million square feet up to 504 buildings that make up 39 million square feet of space. The major take away from this last quarter’s numbers is that Houston’s rapid growth is obscuring just how significant the change in the price of oil has affected this market. If oil stayed at pre 2015 levels I think we would have seen vacancy rates almost cut in half in this market and we would be at a 7% to 8% vacancy rate instead of 14%.
This is a great time to consider renegotiating long term leases as well as considering all of your options when looking where to lay your hat in this market. Some landlords will be more incentivized than others, but it is clear that enough of them have lowered rates to drop the average rent under $30 bucks a foot. Compare this adjustment to downtown Houston that has a similar vacancy rate but the average rents have gone up from $36 bucks a foot the fist quarter of 2015 up to $39 the first quarter of 2016. [CBD Historical Rent All Classes]
What are your thoughts on the energy corridor? Do you see the market bouncing back this year or do you expect more adjustments will be necessary? Leave your thoughts in the description and we will meet you there to talk! Thanks for watching![/fusion_text][/fusion_builder_column][/fusion_builder_row][/fusion_builder_container]